Lab 2: Local Fake GPU Setup
This lab walks you through setting up a fully local Kubernetes cluster — using either OrbStack (macOS) or kind (Linux/Ubuntu) — together with run-ai/fake-gpu-operator, then installing HAMi online.
This lab does not require a real NVIDIA GPU. It is designed for classroom preparation, understanding HAMi component architecture, verifying GPU Pod scheduling workflows, and quickly getting familiar with basic HAMi usage on a personal computer.
What You'll Get
After completing this lab, you will have a local Kubernetes cluster with:
- fake-gpu-operator simulating
nvidia.com/gpuresources on CPU nodes - HAMi scheduler, admission webhook, and other control plane components running normally
- Regular Pods can request simulated GPUs via
nvidia.com/gpu - You can observe the complete chain from fake GPU resource discovery, Pod request, scheduling, to running
fake GPU does not represent real GPU memory isolation, compute isolation, CUDA runtime, or driver capabilities. This lab is for understanding HAMi components and basic scheduling workflows. Real memory slicing (nvidia.com/gpumem), compute limits (nvidia.com/gpucores), CUDA program execution, and performance isolation still require a real NVIDIA GPU environment.
Installation Overview
The entire local installation process consists of 7 steps:
| Step | Purpose | What It Solves |
|---|---|---|
| Set Up & Verify Environment | Create/verify cluster, check kubectl and Helm | Ensure Kubernetes cluster is available |
| Install fake-gpu-operator | Simulate NVIDIA GPU resources | Allow nodes without GPUs to report nvidia.com/gpu |
| Install HAMi | Deploy HAMi control plane | Observe HAMi scheduler, webhook, and other components |
| Install Prometheus | Deploy monitoring stack | Collect GPU metrics and provide data source for HAMi WebUI |
| Run Simulated GPU Workloads | Verify scheduling workflow | Experience Pod GPU request and scheduling |
| Install HAMi WebUI | Deploy visual management interface | Graphically view GPU nodes, resource allocation, and usage trends |
| Observe HAMi and fake GPU | Understand component responsibility boundaries | Clarify which capabilities require real GPUs |
Prerequisites
- macOS (OrbStack)
- Linux (Ubuntu + kind)
- macOS, Intel or Apple Silicon
- OrbStack installed with built-in Kubernetes enabled
- Access to GitHub, GHCR, and the HAMi Helm repository
- At least 4 CPU and 8 GB of memory available
OrbStack comes with built-in Kubernetes (based on k3s), so there's no need to install kind or Docker Desktop separately. It uses fewer resources, starts faster, and is the preferred choice for local labs on macOS.
Check Helm (needed later for installing fake-gpu-operator and HAMi):
helm version
If Helm is not installed:
brew install helm
- Ubuntu 20.04 LTS or later, x86_64 or ARM64
- Docker Engine installed and running
kindv0.20.0 or laterkubectlinstalled- Helm 3.x or later
- Access to GitHub, GHCR, and the HAMi Helm repository
- At least 4 CPU and 8 GB of memory available
kind (Kubernetes IN Docker) runs a full Kubernetes cluster inside Docker containers. It works on any Linux distribution that has Docker, requires no special OS integration, and is the standard tool for local Kubernetes development on Linux.
If you need to install any prerequisites, run the following block:
# Docker Engine
curl -fsSL https://get.docker.com | sudo sh
sudo usermod -aG docker $USER
newgrp docker

# kind
KIND_VERSION=v0.23.0
curl -Lo ./kind "https://kind.sigs.k8s.io/dl/${KIND_VERSION}/kind-linux-amd64"
chmod +x ./kind && sudo mv ./kind /usr/local/bin/kind

# kubectl
curl -LO "https://dl.k8s.io/release/$(curl -L -s https://dl.k8s.io/release/stable.txt)/bin/linux/amd64/kubectl"
sudo install -o root -g root -m 0755 kubectl /usr/local/bin/kubectl && rm kubectl

# Helm
curl https://raw.githubusercontent.com/helm/helm/main/scripts/get-helm-3 | bash
Step 1: Set Up and Verify Local Environment
- macOS
- Linux
OrbStack's Kubernetes starts automatically once you enable it in the OrbStack UI. Verify the cluster is ready:
kubectl version
Example output:
Client Version: v1.33.9
Kustomize Version: v5.6.0
Server Version: v1.33.9+orb1
The +orb1 suffix in Server Version identifies OrbStack's built-in Kubernetes distribution.
View cluster nodes:
kubectl get nodes -o wide
Example output:
NAME       STATUS   ROLES                  AGE    VERSION        INTERNAL-IP     EXTERNAL-IP   OS-IMAGE   KERNEL-VERSION                            CONTAINER-RUNTIME
orbstack   Ready    control-plane,master   148d   v1.33.9+orb1   192.168.139.2   <none>        OrbStack   7.0.5-orbstack-00330-ge3df4e19b0a0-dirty  docker://29.4.0
Create a local Kubernetes cluster:
kind create cluster --name hami-lab
Example output:
Creating cluster "hami-lab" ...
 ✓ Ensuring node image (kindest/node:v1.32.2) 🖼
 ✓ Preparing nodes 📦
 ✓ Writing configuration 📜
 ✓ Starting control-plane 🕹️
 ✓ Installing CNI 🔌
 ✓ Installing StorageClass 💾
Set kubectl context to "kind-hami-lab"
The --name hami-lab flag names the cluster. The resulting node will be called hami-lab-control-plane. kind automatically sets your kubectl context to the new cluster.
Verify the cluster is ready:
kubectl version
Example output:
Client Version: v1.32.2
Kustomize Version: v5.5.0
Server Version: v1.32.2
View cluster nodes:
kubectl get nodes -o wide
Example output:
NAME                     STATUS   ROLES           AGE   VERSION   INTERNAL-IP   EXTERNAL-IP   OS-IMAGE                        KERNEL-VERSION      CONTAINER-RUNTIME
hami-lab-control-plane   Ready    control-plane   2m    v1.32.2   172.18.0.2    <none>        Debian GNU/Linux 12 (bookworm)  6.5.0-41-generic    containerd://1.7.18
Set the NODE_NAME Variable
The rest of this lab uses a NODE_NAME shell variable to avoid hard-coding the node name. Set it once here; all subsequent commands consume it automatically:
NODE_NAME=$(kubectl get nodes -o jsonpath='{.items[0].metadata.name}')
echo "NODE_NAME=${NODE_NAME}"
| Platform | Example value |
|---|---|
| macOS | orbstack |
| Linux | hami-lab-control-plane |
From here on, all commands work the same on macOS and Linux. The only difference you will notice is your node name in example outputs.
Step 2: Install fake-gpu-operator
fake-gpu-operator simulates GPU resources on nodes without NVIDIA GPUs and sets the node capacity to nvidia.com/gpu. This step replaces the NVIDIA GPU Operator, drivers, device-plugin, and DCGM metrics collection pipeline that would be present in a real GPU environment.
2.1 Create Namespace and Set Security Policy
kubectl create namespace gpu-operator
kubectl label namespace gpu-operator pod-security.kubernetes.io/enforce=privileged
namespace/gpu-operator created
namespace/gpu-operator labeled
The
gpu-operatornamespace is dedicated to fake-gpu-operator components. Theprivilegedlabel allows Pods to run in privileged mode; the fake-gpu-operator's device-plugin needs access to host device files.
2.2 Label the Node
fake-gpu-operator uses node labels to determine which nodes should simulate GPUs:
kubectl label node ${NODE_NAME} run.ai/simulated-gpu-node-pool=default
node/<NODE_NAME> labeled
The label
run.ai/simulated-gpu-node-pool=defaulttells fake-gpu-operator: "Simulate GPUs on this node."
2.3 Install fake-gpu-operator
export FAKE_GPU_OPERATOR_VERSION=0.0.80

helm upgrade -i gpu-operator \
    oci://ghcr.io/run-ai/fake-gpu-operator/fake-gpu-operator \
    --namespace gpu-operator \
    --create-namespace \
    --version ${FAKE_GPU_OPERATOR_VERSION}
Release "gpu-operator" does not exist. Installing it now.
Pulled: ghcr.io/run-ai/fake-gpu-operator/fake-gpu-operator:0.0.80
Digest: sha256:...
NAME: gpu-operator
LAST DEPLOYED: ...
NAMESPACE: gpu-operator
STATUS: deployed
REVISION: 1
TEST SUITE: None
helm upgrade -iinstalls if the release doesn't exist, upgrades if it does. Theoci://prefix pulls the Helm Chart from GitHub Container Registry.0.0.80is a stable version released in 2026-04.
2.4 Wait for Components to Run
kubectl get pods -n gpu-operator
Example output:
NAME                                       READY   STATUS    RESTARTS   AGE
device-plugin-l8m6j                        1/1     Running   0          31m
kwok-gpu-device-plugin-5996cdf4f9-mfvpm    1/1     Running   0          31m
nvidia-dcgm-exporter-knfsn                 1/1     Running   0          31m
nvidia-dcgm-exporter-kwok-b8fd4976-blb8c   1/1     Running   0          31m
status-updater-59965d7bc6-fbkmk            1/1     Running   0          31m
topology-server-9d57b6c79-7dv6h            1/1     Running   0          31m
Component descriptions:
device-plugin: DaemonSet running on each GPU node, reporting GPU resources to Kuberneteskwok-gpu-device-plugin: Uses KWOK (Kubernetes WithOut Kubelet) to simulate GPU devicesnvidia-dcgm-exporter: Simulates DCGM metrics export (GPU temperature, utilization, etc.)status-updater: Updates node GPU statustopology-server: Manages GPU topology information
If all Pods are Running with READY at 1/1, the installation is successful.
2.5 Verify Simulated GPU Resources
Check whether the node reports GPU capacity:
kubectl get node ${NODE_NAME} \
    -o custom-columns=NAME:.metadata.name,GPU:.status.capacity.nvidia\\.com/gpu
NAME       GPU
<NODE_NAME>   2
The
GPUcolumn shows2, meaning fake-gpu-operator has simulated 2 GPUs on the node.
View the node's detailed GPU labels:
kubectl get node ${NODE_NAME} --show-labels | tr ',' '\n' | grep -E 'nvidia.com/gpu|run.ai'
nvidia.com/gpu.count=2
nvidia.com/gpu.deploy.dcgm-exporter=true
nvidia.com/gpu.deploy.device-plugin=true
nvidia.com/gpu.memory=11441
nvidia.com/gpu.present=true
nvidia.com/gpu.product=Tesla-K80
run.ai/fake.gpu=true
run.ai/simulated-gpu-node-pool=default
These labels simulate a real GPU node:
nvidia.com/gpu.count=2: 2 GPUs simulatednvidia.com/gpu.product=Tesla-K80: Simulated GPU modelnvidia.com/gpu.memory=11441: 11441 MiB VRAM per GPUrun.ai/fake.gpu=true: Marks this as a simulated GPU
If the GPU column is empty, confirm the node label was applied:
kubectl get node ${NODE_NAME} --show-labels | grep run.ai/simulated-gpu-node-pool
Step 3: Install HAMi
This step installs HAMi's control plane components:
hami-scheduler: Scheduling enhancement component that participates in GPU Pod scheduling decisions- Admission webhook: Automatically rewrites GPU Pod scheduler configuration
- Helm release: Manages all HAMi-related Kubernetes resources
In the fake GPU environment, GPU resources are provided by fake-gpu-operator. To avoid two device-plugins simultaneously registering nvidia.com/gpu, this lab does not let the HAMi device-plugin take over the fake nodes.
3.1 Add the HAMi Helm Repository
helm repo add hami-charts https://project-hami.github.io/HAMi/
helm repo update
"hami-charts" has been added to your repositories
...Successfully got an update from the "hami-charts" chart repository
Update Complete. ⎈Happy Helming!⎈
3.2 Install HAMi
helm install hami hami-charts/hami \
    -n kube-system \
    --set devicePlugin.enabled=false
NAME: hami
LAST DEPLOYED: ...
NAMESPACE: kube-system
STATUS: deployed
REVISION: 1
TEST SUITE: None
--set devicePlugin.enabled=falseis the key parameter. Because fake-gpu-operator is already managing GPU devices, starting HAMi's device-plugin as well would cause a conflict. Only HAMi's scheduling enhancement components are installed here.
3.3 Verify HAMi Components
kubectl get pods -n kube-system | grep hami
hami-scheduler-5d9678f989-dnf65 2/2 Running 0 28m
2/2indicates this Pod has 2 containers (scheduler + webhook), both running normally.
View HAMi's control plane resources:
kubectl get deploy,svc,cm,sa -n kube-system | grep hami
deployment.apps/hami-scheduler           1/1     1            1           28m
service/hami-scheduler   NodePort    192.168.194.156   <none>        443:31998/TCP,31993:31993/TCP   28m
configmap/hami-scheduler                                         1      28m
configmap/hami-scheduler-device                                  1      28m
serviceaccount/hami-scheduler                                0         28m
3.4 Confirm All Helm Releases
helm list -A
NAME         NAMESPACE    REVISION  STATUS   CHART                    APP VERSION
gpu-operator gpu-operator 1         deployed fake-gpu-operator-0.0.80 0.0.80
hami         kube-system  1         deployed hami-2.9.0               2.9.0
Both Helm Releases show
deployedstatus.
Step 4: Install Prometheus
HAMi WebUI needs to read GPU metrics from Prometheus. This step deploys a complete monitoring stack using kube-prometheus-stack.
HAMi WebUI's cluster overview, GPU utilization, memory usage, and other chart data all come from Prometheus. Without Prometheus, the WebUI can only display blank pages.
4.1 Add the Helm Repository
helm repo add prometheus-community https://prometheus-community.github.io/helm-charts
helm repo update
4.2 Install kube-prometheus-stack
helm install prometheus prometheus-community/kube-prometheus-stack \
    -n monitoring --create-namespace \
    --set grafana.enabled=false \
    --version=75.15.1
NAME: prometheus
LAST DEPLOYED: ...
NAMESPACE: monitoring
STATUS: deployed
REVISION: 1
--set grafana.enabled=falseskips Grafana installation. This lab only uses Prometheus as the data source for HAMi WebUI. Remove this parameter if you want Grafana for richer visualizations.
4.3 Wait for Prometheus to Be Ready
kubectl get pods -n monitoring
Example output:
NAME                                                     READY   STATUS    RESTARTS   AGE
alertmanager-prometheus-kube-prometheus-alertmanager-0   2/2     Running   0          2m
prometheus-kube-prometheus-operator-d89fb8945-htjjd      1/1     Running   0          2m
prometheus-kube-state-metrics-7f5f75c85d-mbsbh           1/1     Running   0          2m
prometheus-prometheus-kube-prometheus-prometheus-0       2/2     Running   0          2m
prometheus-prometheus-node-exporter-77pxd                1/1     Running   0          2m
4.4 Create ServiceMonitor to Collect GPU Metrics
The ServiceMonitors included with kube-prometheus-stack do not cover fake-gpu-operator's GPU metrics. Create one manually:
kubectl apply -f - <<'EOF'
apiVersion: monitoring.coreos.com/v1
kind: ServiceMonitor
metadata:
  name: nvidia-dcgm-exporter
  namespace: gpu-operator
  labels:
    release: prometheus
spec:
  selector:
    matchLabels:
      app: nvidia-dcgm-exporter
  namespaceSelector:
    matchNames:
      - gpu-operator
  endpoints:
    - port: gpu-metrics
      path: /metrics
      interval: 15s
EOF
servicemonitor.monitoring.coreos.com/nvidia-dcgm-exporter created
The ServiceMonitor tells Prometheus: "Go to the
gpu-operatornamespace, find the Service with labelapp: nvidia-dcgm-exporter, and scrape/metricsfrom itsgpu-metricsport every 15 seconds." Therelease: prometheuslabel is required by kube-prometheus-stack's ServiceMonitor selector.
Wait about 30 seconds, then verify GPU metrics are being collected:
kubectl exec -n monitoring prometheus-prometheus-kube-prometheus-prometheus-0 -- \
    promtool query instant http://localhost:9090 'DCGM_FI_DEV_GPU_UTIL'
DCGM_FI_DEV_GPU_UTIL{..., device="nvidia1", ..., modelName="Tesla-K80", ...} => 0
DCGM_FI_DEV_GPU_UTIL{..., device="nvidia0", ..., modelName="Tesla-K80", ...} => 0
Seeing
DCGM_FI_DEV_GPU_UTILdata means Prometheus is collecting fake GPU metrics. A utilization of 0 is normal — there are no real GPU compute tasks running.
Step 5: Run Simulated GPU Workloads
Verify that Kubernetes can schedule Pods requesting nvidia.com/gpu to the fake GPU node. fake-gpu-operator injects a simulated nvidia-smi tool into GPU Pods for observing GPU visibility.
Since this lab does not enable the HAMi device-plugin, the test Pod explicitly bypasses the HAMi webhook and uses the default Kubernetes scheduler with the simulated GPU resources provided by fake-gpu-operator.
5.1 Create a Test Pod
Review the Pod YAML before applying:
apiVersion: v1
kind: Pod
metadata:
  name: fake-gpu-pod
  labels:
    hami.io/webhook: ignore
  annotations:
    run.ai/simulated-gpu-utilization: "10-30"
spec:
  restartPolicy: Never
  containers:
  - name: app
    image: ubuntu:22.04
    command: [ "bash", "-lc", "sleep 3600" ]
    resources:
      requests:
        cpu: "100m"
        memory: "128Mi"
      limits:
        cpu: "500m"
        memory: "512Mi"
        nvidia.com/gpu: 1
    env:
    - name: NODE_NAME
      valueFrom:
        fieldRef:
          fieldPath: spec.nodeName
YAML key points:
hami.io/webhook: ignore: Tells the HAMi webhook not to intercept this Pod, using the default scheduler insteadrun.ai/simulated-gpu-utilization: "10-30": fake-gpu-operator will makenvidia-smireport 10%–30% GPU utilizationresources.limits.nvidia.com/gpu: 1: Requests 1 GPUsleep 3600: Keeps the container running for 1 hour for observation
Apply the Pod:
kubectl apply -f fake-gpu-pod.yaml
pod/fake-gpu-pod created
5.2 Wait for the Pod to Run
kubectl get pod fake-gpu-pod -o wide
NAME           READY   STATUS    RESTARTS   AGE   IP           NODE         NOMINATED NODE   READINESS GATES
fake-gpu-pod   1/1     Running   0          7m    <pod-ip>     <NODE_NAME>  <none>           <none>
STATUS: Runningand your node name in theNODEcolumn confirm the Pod was successfully scheduled. If pullingubuntu:22.04for the first time, it may take a few dozen seconds.
5.3 View the Pod's GPU Resource Request
kubectl describe pod fake-gpu-pod | grep -A6 "Limits"
    Limits:
      nvidia.com/gpu:  1
    Requests:
      nvidia.com/gpu:  1
5.4 View Node GPU Resource Allocation
kubectl describe node ${NODE_NAME} | grep -A10 "Allocated resources"
Allocated resources:
  Resource           Requests     Limits
  --------           --------     ------
  cpu                750m (7%)    1700m (17%)
  memory             870Mi (10%)  1996Mi (24%)
  nvidia.com/gpu     1            1
The
nvidia.com/gpurow shows both Requests and Limits as1, meaning 1 GPU is occupied. The node has 2 GPUs total, so 1 more can be allocated.
5.5 Execute Simulated nvidia-smi
Run nvidia-smi inside the Pod to confirm fake-gpu-operator successfully injected the simulated GPU tool:
kubectl exec fake-gpu-pod -- nvidia-smi
Thu May 21 08:44:31 2026
+------------------------------------------------------------------------------+
| NVIDIA-SMI 470.129.06   Driver Version: 470.129.06   CUDA Version: 11.4      |
+--------------------------------+----------------------+----------------------+
| GPU  Name        Persistence-M | Bus-Id        Disp.A | Volatile Uncorr. ECC |
| Fan  Temp  Perf  Pwr:Usage/Cap |         Memory-Usage | GPU-Util  Compute M. |
|                                |                      |               MIG M. |
+--------------------------------+----------------------+----------------------+
|   0  Tesla-K80             Off | 00000001:00:00.0 Off |                  Off |
| N/A   33C    P8    11W /  70W  |  11441MiB / 11441MiB |      18%     Default |
|                                |                      |                  N/A |
+--------------------------------+----------------------+----------------------+

+------------------------------------------------------------------------------+
| Processes:                                                                   |
|  GPU   GI   CI        PID   Type   Process name                  GPU Memory  |
|        ID   ID                                                   Usage       |
+------------------------------------------------------------------------------+
|    0   N/A  N/A       23       G   sleep 3600                       11441MiB |
+------------------------------------------------------------------------------+
Output interpretation:
- GPU 0: Tesla-K80: Simulated GPU model, consistent with node label
nvidia.com/gpu.product=Tesla-K80- 11441MiB / 11441MiB: Memory used/total, consistent with
nvidia.com/gpu.memory=11441- GPU-Util: 18%: Within the range specified by
run.ai/simulated-gpu-utilization: "10-30"- Processes: sleep 3600: The running process visible on the simulated GPU
This output is identical on macOS and Linux — fake-gpu-operator produces the same simulation on both platforms.
Step 6: Install HAMi WebUI
HAMi WebUI provides a graphical GPU resource management interface.
6.1 Add the HAMi WebUI Helm Repository
helm repo add hami-webui https://Project-HAMi.github.io/HAMi-WebUI/
helm repo update
6.2 Add GPU Label to the Node
HAMi WebUI discovers GPU nodes via the gpu=on node label:
kubectl label node ${NODE_NAME} gpu=on
6.3 Add Simulated GPU Registration Information
In a real environment, the HAMi device-plugin automatically writes the hami.io/node-nvidia-register annotation. Because this lab disables the device-plugin, add it manually:
kubectl annotate node ${NODE_NAME} \
  hami.io/node-nvidia-register='[{"id":"GPU-3cef3724-8228-5a66-b391-b0901788f5d0","count":10,"devmem":11441,"devcore":100,"type":"NVIDIA-Tesla-K80","mode":"hami-core","health":true},{"id":"GPU-5127182e-f297-5a25-bb44-0444c3be540c","index":1,"count":10,"devmem":11441,"devcore":100,"type":"NVIDIA-Tesla-K80","mode":"hami-core","health":true}]' \
  hami.io/node-handshake="Requesting_$(date '+%Y.%m.%d %H:%M:%S')"
One JSON object per GPU.
idis the device UUID,countis vGPU partitions per card (default 10),devmemis VRAM in MiB,devcoreis compute capacity in %,modeishami-corefor software-level partitioning.
6.4 Install HAMi WebUI
helm install my-hami-webui hami-webui/hami-webui \
    --set externalPrometheus.enabled=true \
    --set externalPrometheus.address="http://prometheus-kube-prometheus-prometheus.monitoring.svc.cluster.local:9090" \
    --set dcgm-exporter.enabled=false \
    -n kube-system
6.5 Wait for WebUI to Be Ready
kubectl get pods -n kube-system | grep webui
my-hami-webui-85686fd65-77crx 2/2 Running 0 2m
2/2indicates both the frontend and backend containers are running normally.
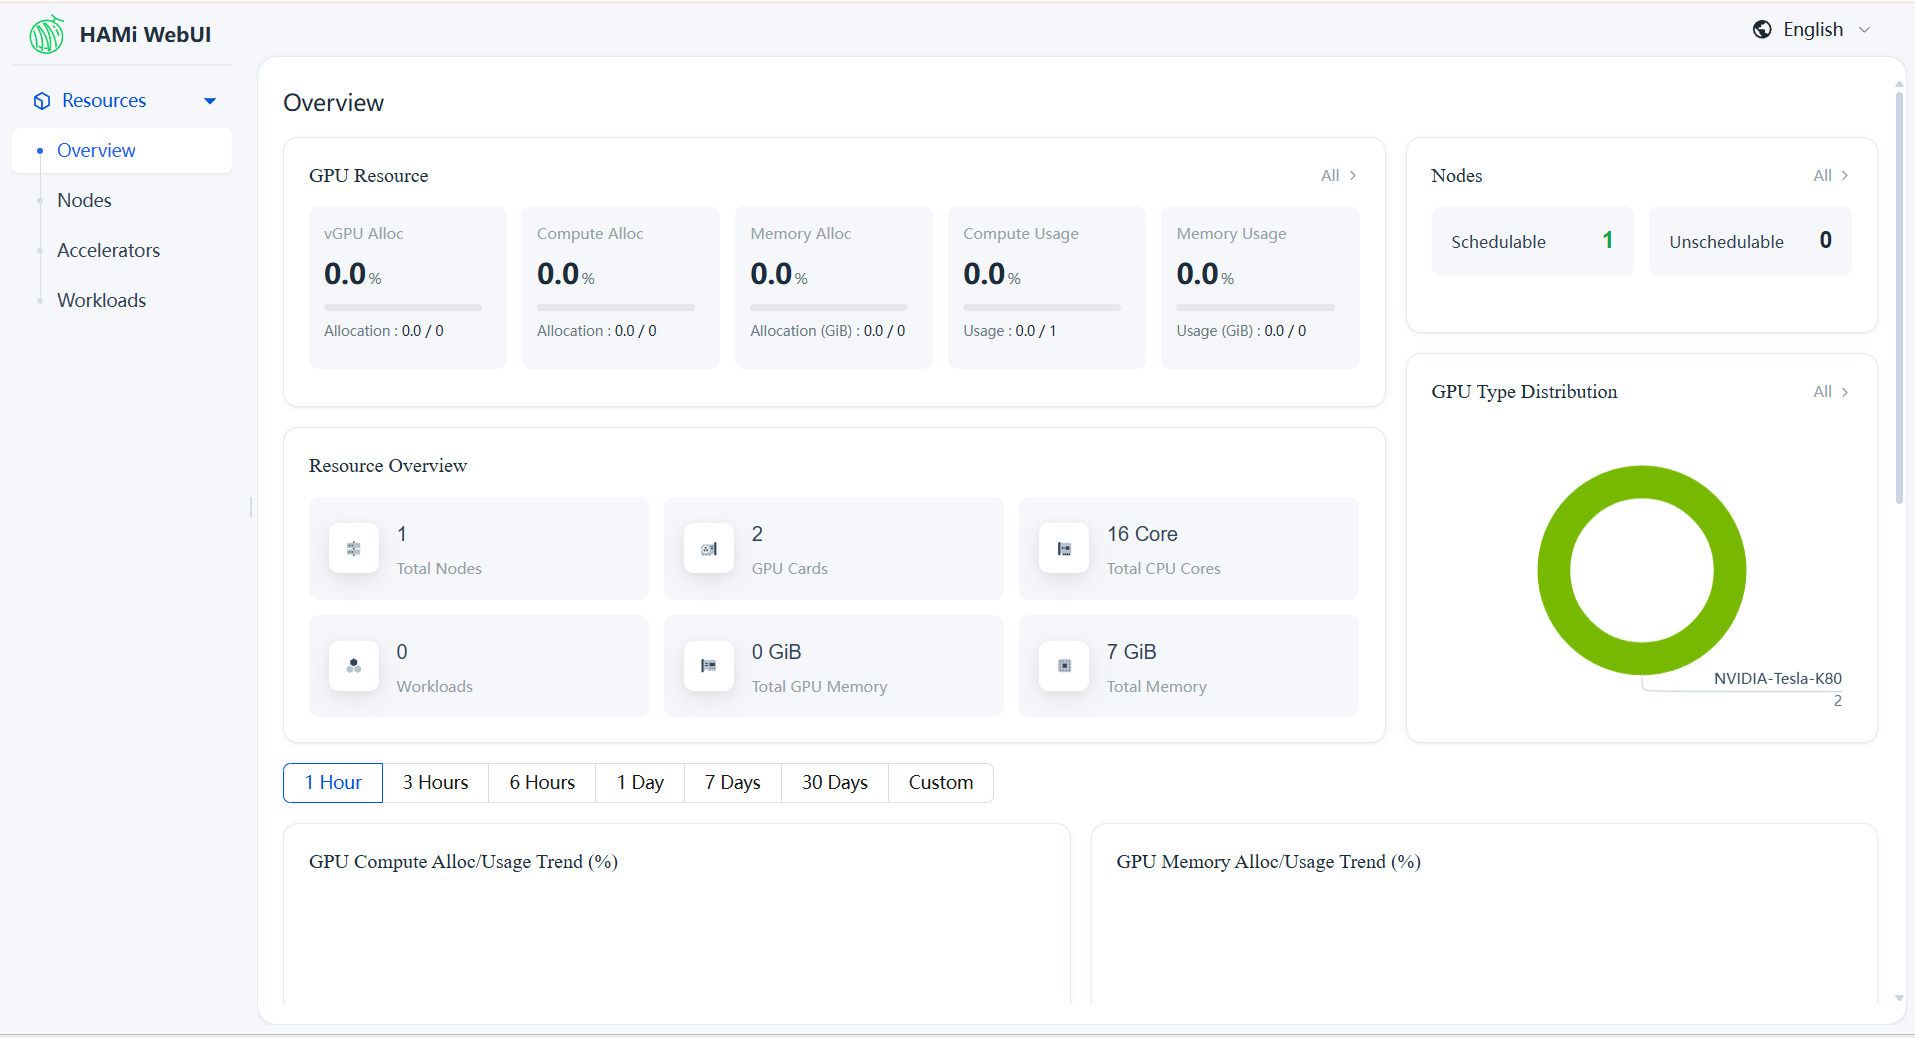
6.6 Access the WebUI
kubectl -n kube-system port-forward svc/my-hami-webui 8080:3000
Open http://localhost:8080/admin/vgpu/monitor/overview in your browser.
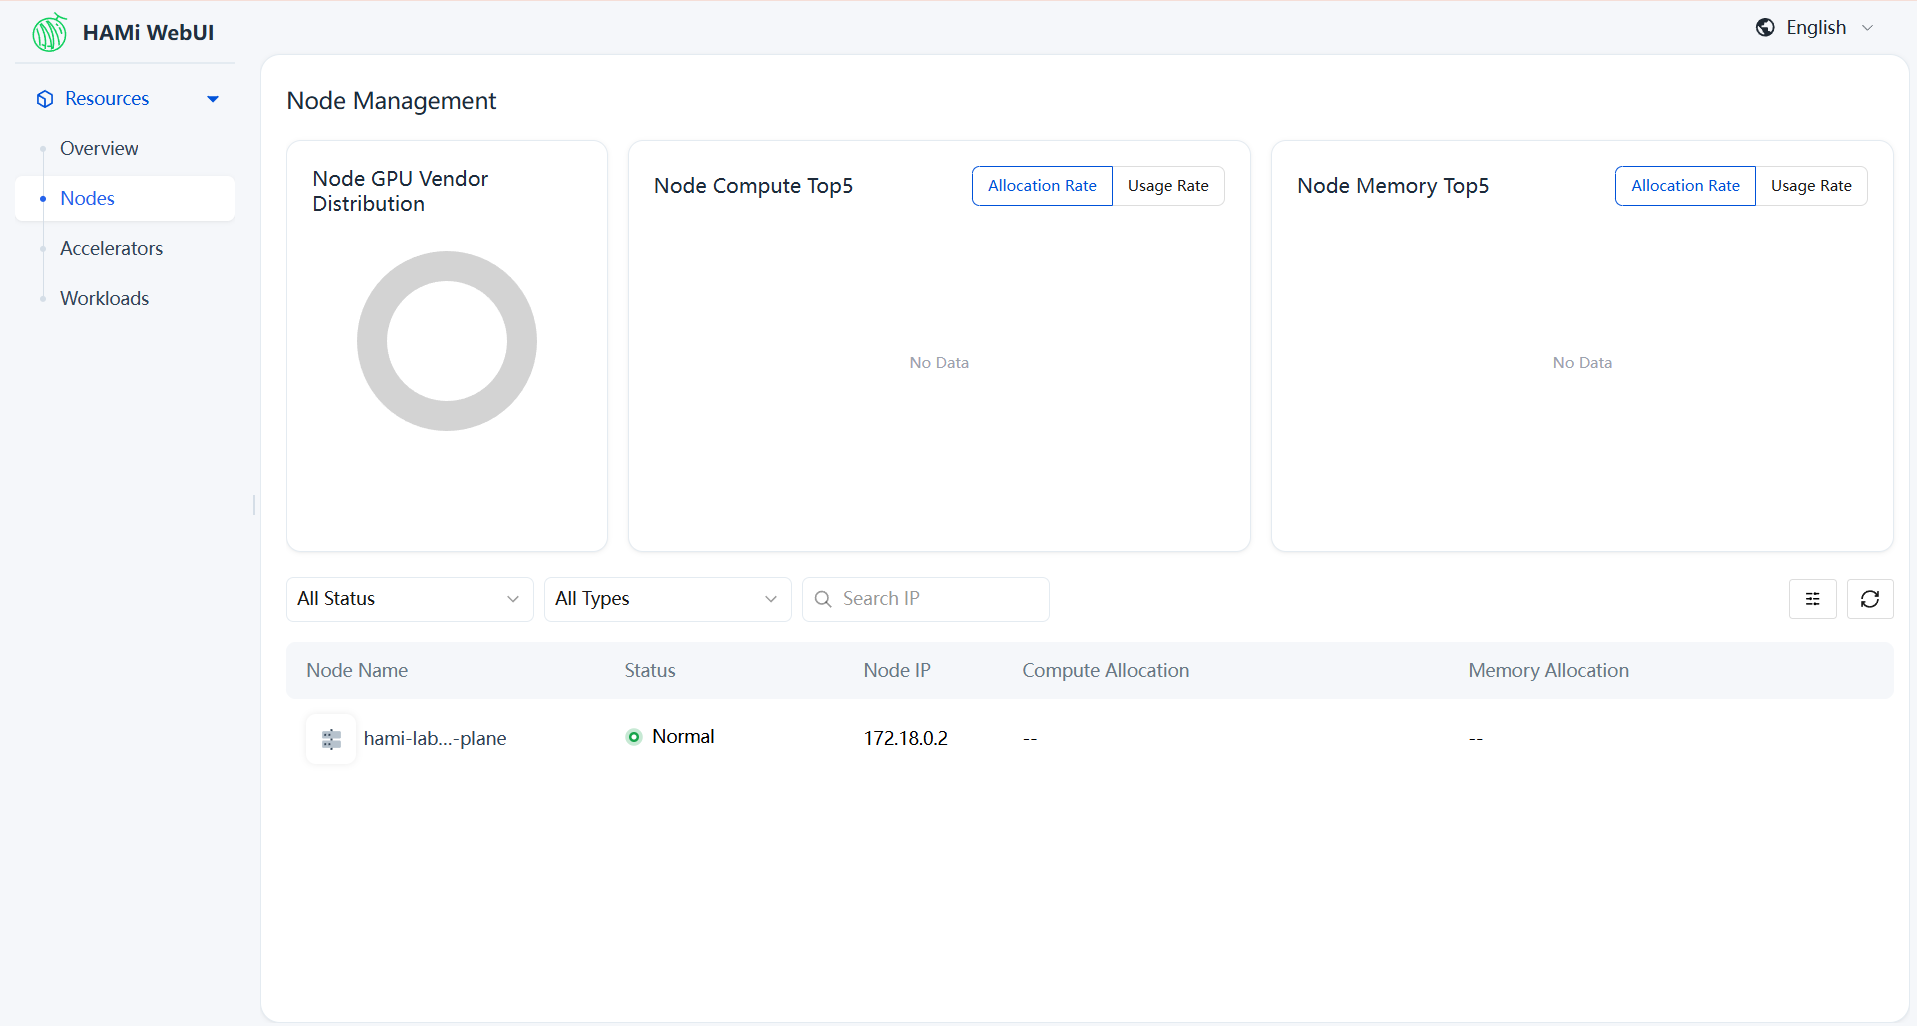
Click Node Management in the left sidebar to view GPU node details:
Step 7: Observe the Boundaries of HAMi and fake GPU
What HAMi Is Responsible for in This Lab
kubectl get deploy,svc,cm,sa -n kube-system | grep hami
HAMi only deployed the scheduler in this lab. Since
devicePlugin.enabled=falsewas set, HAMi's core GPU slicing capability is not enabled.
What fake-gpu-operator Is Responsible for in This Lab
kubectl get daemonset,deploy,pod -n gpu-operator
fake-gpu-operator handles the full lifecycle of simulated devices: device discovery, resource reporting, and metrics export.
View node capacity to confirm registration:
kubectl describe node ${NODE_NAME} | grep -A10 "Capacity:"
Capacity:
  cpu:                10
  ephemeral-storage:  148577276Ki
  memory:             8185404Ki
  nvidia.com/gpu:     2
  pods:               110
What This Lab Cannot Verify
- HAMi device-plugin actually registering GPUs and writing
hami.io/node-nvidia-register nvidia.com/gpumemmemory slicingnvidia.com/gpucorescompute ratio limits- CUDA programs actually running
- Memory overcommit, memory analysis, memory override
- Real DCGM GPU metrics
To continue with these capabilities, use a real GPU environment as described in Lab 1: Online HAMi Installation.
Cleanup
Delete the test Pod:
kubectl delete pod fake-gpu-pod
Uninstall HAMi WebUI, HAMi, and Prometheus:
helm uninstall my-hami-webui -n kube-system
helm uninstall hami -n kube-system
helm uninstall prometheus -n monitoring
kubectl delete namespace monitoring
Uninstall fake-gpu-operator:
helm uninstall gpu-operator -n gpu-operator
kubectl delete namespace gpu-operator
Clean up node labels and annotations:
kubectl label node ${NODE_NAME} gpu- run.ai/simulated-gpu-node-pool-
kubectl annotate node ${NODE_NAME} hami.io/node-nvidia-register- hami.io/node-handshake-
- macOS
- Linux
To stop the Kubernetes cluster, disable it from the OrbStack UI, or quit OrbStack entirely.
Delete the kind cluster:
kind delete cluster --name hami-lab
Deleting cluster "hami-lab" ...
Deleted nodes: ["hami-lab-control-plane"]
If you want to keep the environment for further experimentation, skip the cleanup steps.
Next Steps
After completing this lab, we recommend continuing with HAMi Cluster Architecture, focusing on understanding the responsibility boundaries of the scheduler, device-plugin, webhook, and GPU Operator.
